
Every month, South Africa’s larger municipalities report to Statistics South Africa on the number of building plans they have passed, which is the crucial paperwork stage that precedes a spade going into the ground. This dataset serves as one of the most immediate indicators of where people and capital are seeking approval to build.
Examined province by province since 1994, the data tells a striking story: an increasing share of South Africa’s building activity is concentrating in the Western Cape, a shift that has widened sharply since 2020. This is not simply a matter of the Western Cape building more in nominal terms, but a fundamental shift in where that activity is happening relative to the rest of the country.
The Headline Number: A Three-Decade Reversal
In 2025, building plans worth an estimated R35.0 billion were passed in the Western Cape, accounting for 35.3% of the R99.1 billion passed nationally. Meanwhile, Gauteng passed R28.3 billion, or 28.5% of the national total. This represents a complete reversal from 1994, when Gauteng accounted for 44.4% of national building plans against the Western Cape’s 21.2%.
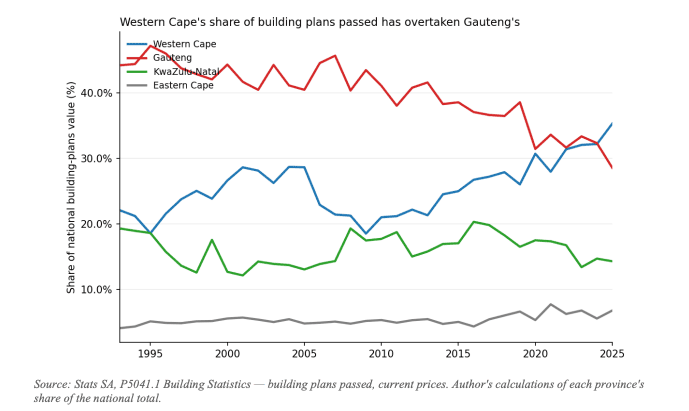
Data from the first half of 2026 shows the Western Cape’s share climbing further still to 36.4%. Crucially, this is supported by physical unit counts: the Western Cape’s share of national residential units approved reached 42.7% in 2025, proving the trend is not just an artifact of rising construction costs.
Bigger Than Population or GDP Weight Implies
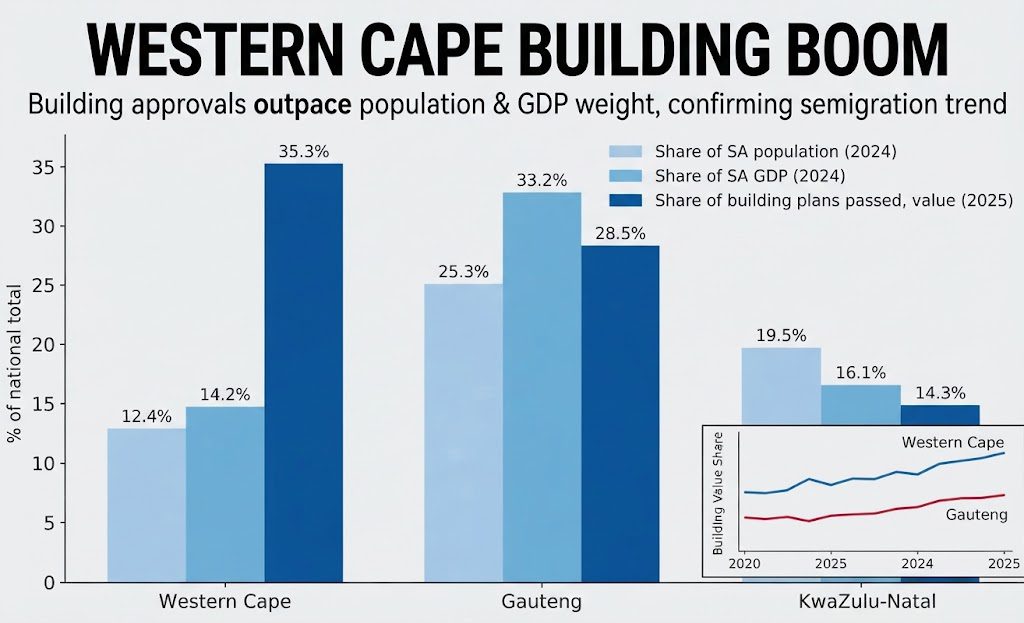
The Western Cape is out-building both its demographic and economic weight:
- Population: In 2024, the Western Cape held roughly 12.4% of South Africa’s population.
- Economic Output: The province generated about 14.2% of national GDP in 2024.
- Building Share: It captured a massive 35.3% of total building plan values in 2025.
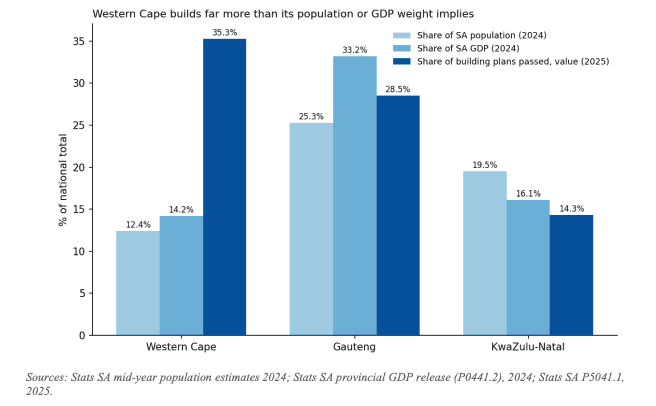
Expressed as a building intensity ratio, the Western Cape is building at roughly 2.85 times its population weight and 2.49 times its GDP weight.
Breaking Down the Numbers: Residential vs. Non-Residential
1. Residential: The Clearest Signal
Residential building values grew at a nominal compound annual growth rate of 8.2% in the Western Cape between 2010 and 2025, which is more than seven times Gauteng’s 1.1% over the same period. While building plans cannot track the exact origin of future occupants, this sustained multi-decade acceleration heavily aligns with the net inward migration recorded in the province.
2. Non-Residential: Commercial and Industrial Growth
Non-residential building follows a similar trajectory. The Western Cape’s share of national non-residential value rose from 13.6% in 1994 to 28.6% in 2025. Rather than driving the shift independently, commercial expansion is largely responding to population growth as businesses build where workers and customers already live.
3. Reinvestment in Existing Stock
Additions and alterations reveal a second major channel of capital flow. The Western Cape accounts for 38.1% of the national value of additions and alterations. Within the province, alterations consistently make up around 30% of total building plans, indicating deep, sustained capital reinvestment into existing housing and commercial stock.
Conclusion
Driven by a combination of consistent economic outperformance, strong net inward migration, and confident developer intentions, the Western Cape has established a dominant position in South Africa’s property and construction landscape. Whether this trajectory can be sustained given local infrastructure constraints on water, electricity, and land remains the critical question for the future.
