

Building Through Five Presidencies: The Structural Transformation of South Africa’s Construction Cycles
Introduction: Looking Beyond the Union Buildings
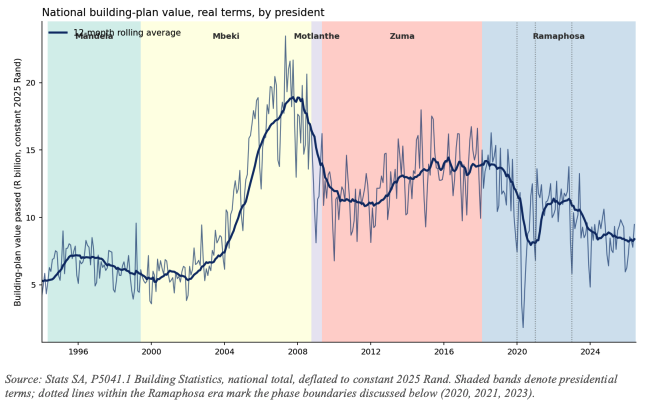
Following our look at provincial distribution in Part 1, Part 2 of this series steps back to the national level. It investigates how South Africa’s building-plan pipeline shifted through the administrations of Nelson Mandela, Thabo Mbeki, Kgalema Motlanthe, Jacob Zuma, and Cyril Ramaphosa. While approval trends correlate with interest rates, global cycles, and load-shedding rather than any single administration’s direct design, the 32-year dataset reveals a compelling macro story: a mid-2000s peak, a sideways plateau under Zuma, and a persistent post-2008 contraction that has not recovered under Ramaphosa.
1. Level vs. Momentum Across Administrations
To accurately evaluate presidential terms, economists separate level (average activity volume) from momentum (whether activity accelerated or decelerated from start to end). All figures are adjusted to constant 2025 Rand to eliminate inflation distortions.
- Nelson Mandela (1994–1999): Averaged R78.0 billion/year in real building plans passed, closing with an 11% contraction momentum.
- Thabo Mbeki (1999–2008): Averaged R132.1 billion/year, characterized by an explosive 212% growth momentum during the global credit and commodity boom.
- Kgalema Motlanthe (2008–2009): A brief 7-month caretaker stint averaging R146.7 billion/year right as the global financial crisis struck.
- Jacob Zuma (2009–2018): Recorded the highest average annual level at R152.4 billion/year, inheriting Mbeki’s high base and growing modestly by 19% from the post-crisis trough.
- Cyril Ramaphosa (2018–Present): Averaged R121.9 billion/year with a downward momentum of 39%, driven by pre-COVID softening, the severe 2020 pandemic shock, a brief 2021–2022 rebound, and a persistent decline since 2023.
2. Summary of Presidential Building Performance
| President | Term Length | Avg. Level (2025 R billion/yr) | Momentum (First vs. Last 12mo) | Avg. Floor Area / Unit | Real Value per Unit |
|---|---|---|---|---|---|
| Mandela | 5.1 years | R78.0 | -11% | 101 m² | R481,048 |
| Mbeki | 9.3 years | R132.1 | +212% | 120 m² | R796,801 |
| Motlanthe | 0.6 years | R146.7 | N/A (Too short) | 112 m² | R978,652 |
| Zuma | 8.8 years | R152.4 | +19% | 127 m² | R1,296,860 |
| Ramaphosa | 8.4 years (ongoing) | R121.9 | -39% | 144 m² | R1,411,452 |
3. The Core Structural Shift: Fewer Homes, Bigger Budgets
The most vital revelation in the national data is hidden behind the headline Rand values:
- Halved Unit Volumes: The annual volume of approved residential units (houses, flats, townhouses combined) has dropped in every term since Mbeki, falling from an average of 89,487 units down to 44,078 units under Ramaphosa (a drop of over 50%).
- Expanding Dimensions: The physical size of approved homes has grown steadily from an average of 101 square metres under Mandela to 144 square metres under Ramaphosa.
- Escalating Construction Costs: Real building costs per square metre have roughly doubled since the mid-1990s, driving the average real cost per residential unit from roughly R481,000 to over R1.41 million.
Conclusion
Ultimately, the long-term building dataset paints a picture of a structurally transformed South African economy. The frantic multi-sector expansion of the mid-2000s has not repeated itself. Instead, both residential and non-residential development pipelines have settled into a pattern of producing less total space at significantly higher real costs per square metre.
